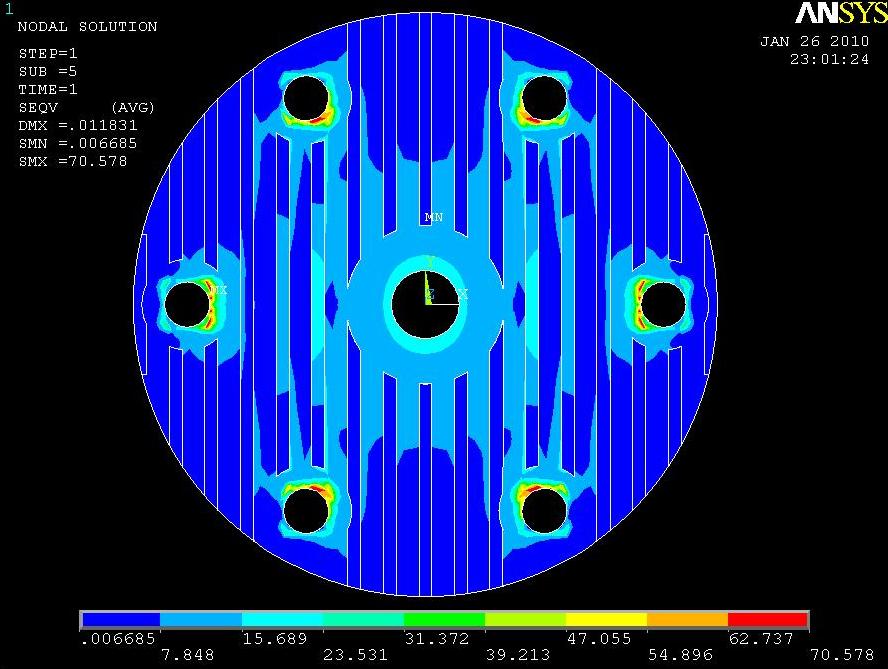
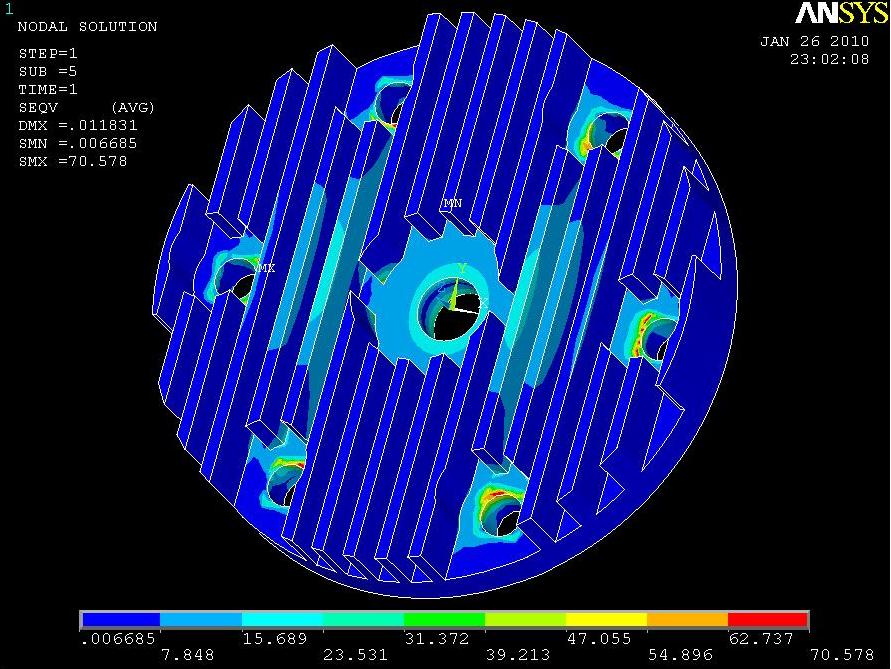
Calculations for the load 10 times greater
As the stresses for normal load were small, it
had to be checked when the stress exceeds the yield value.
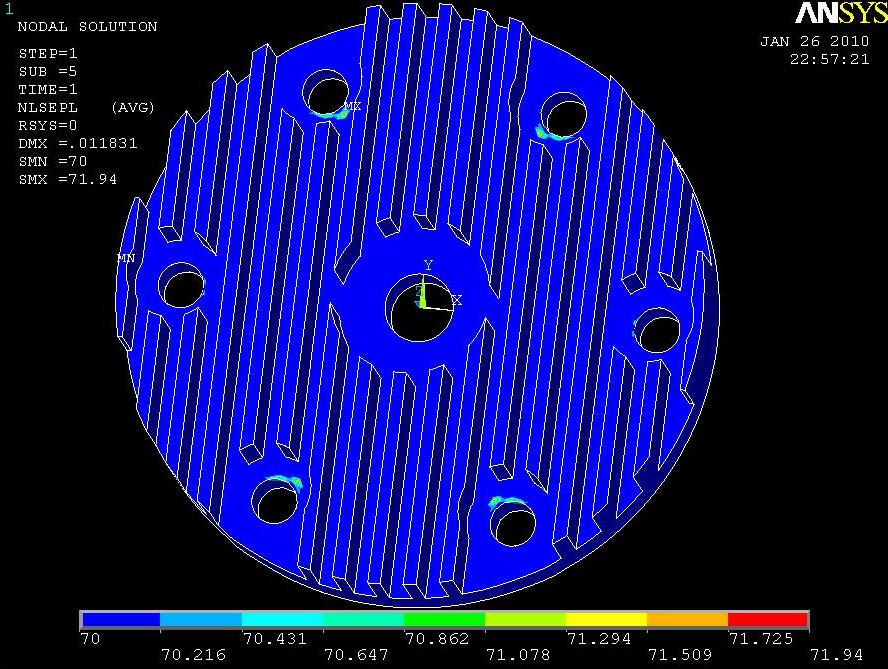
von Misesa (Hubera) stress
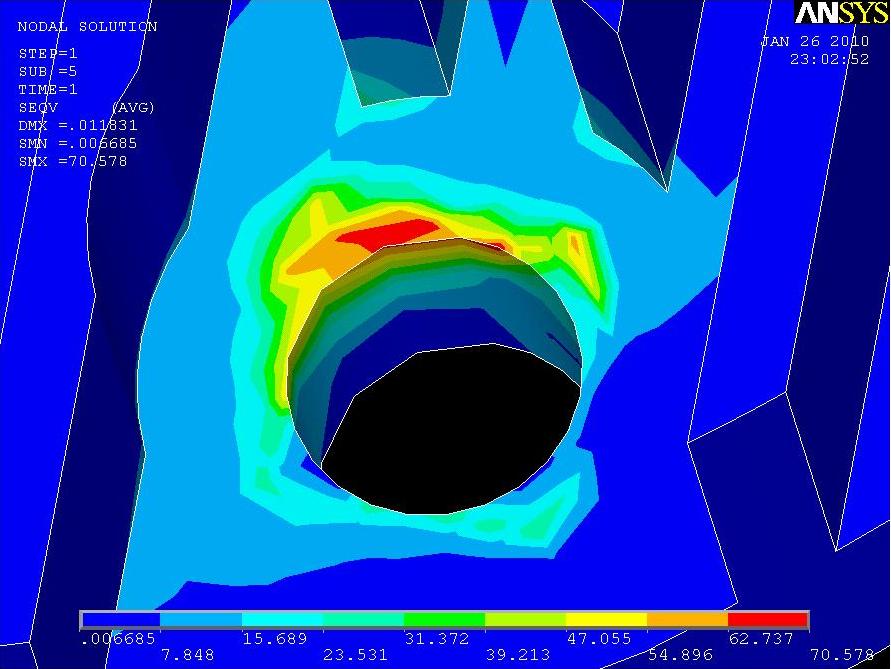
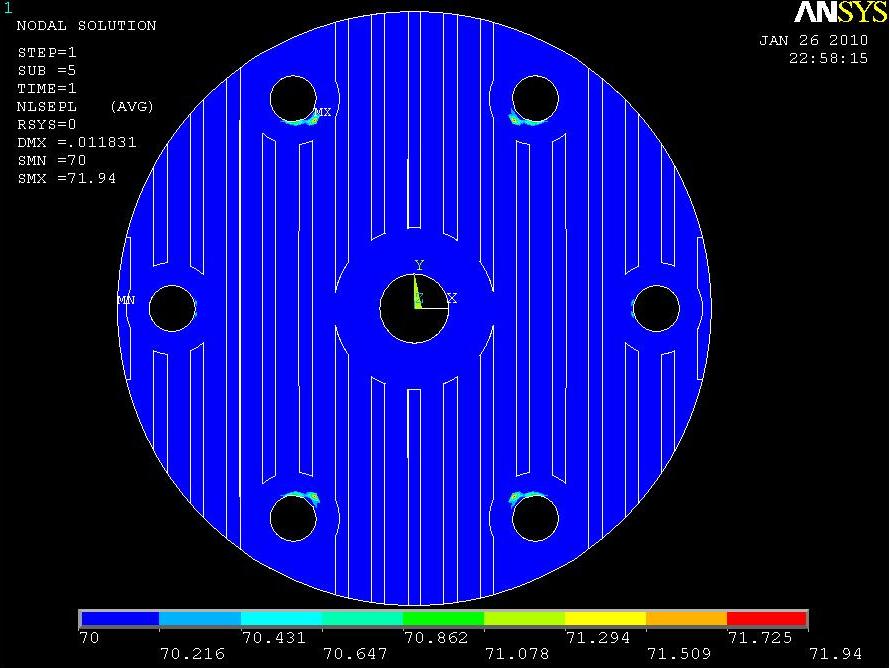
Plastic equivalent stress
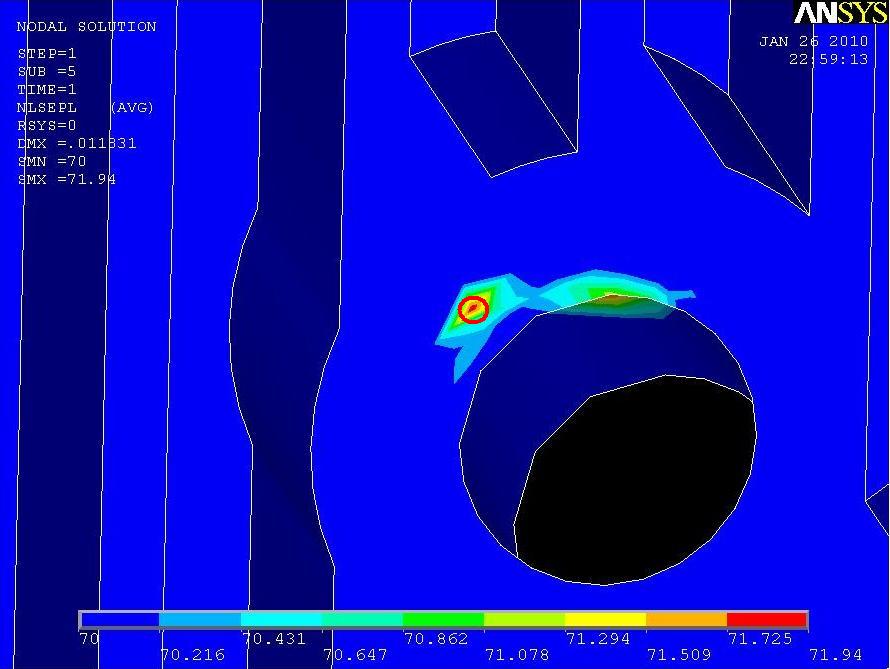
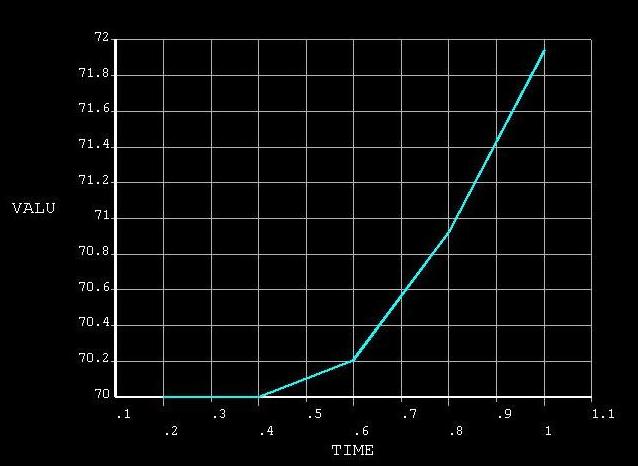
Graphs, shown below, were based on the point marked in the picture above.
von Mises (Huber) stress diagram
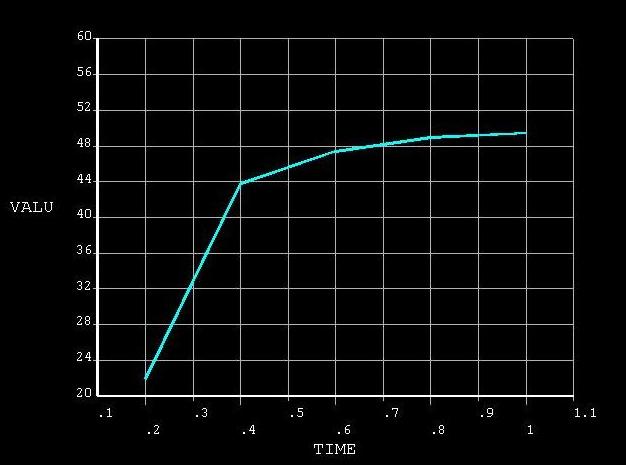
Plastic equivalent stress diagram